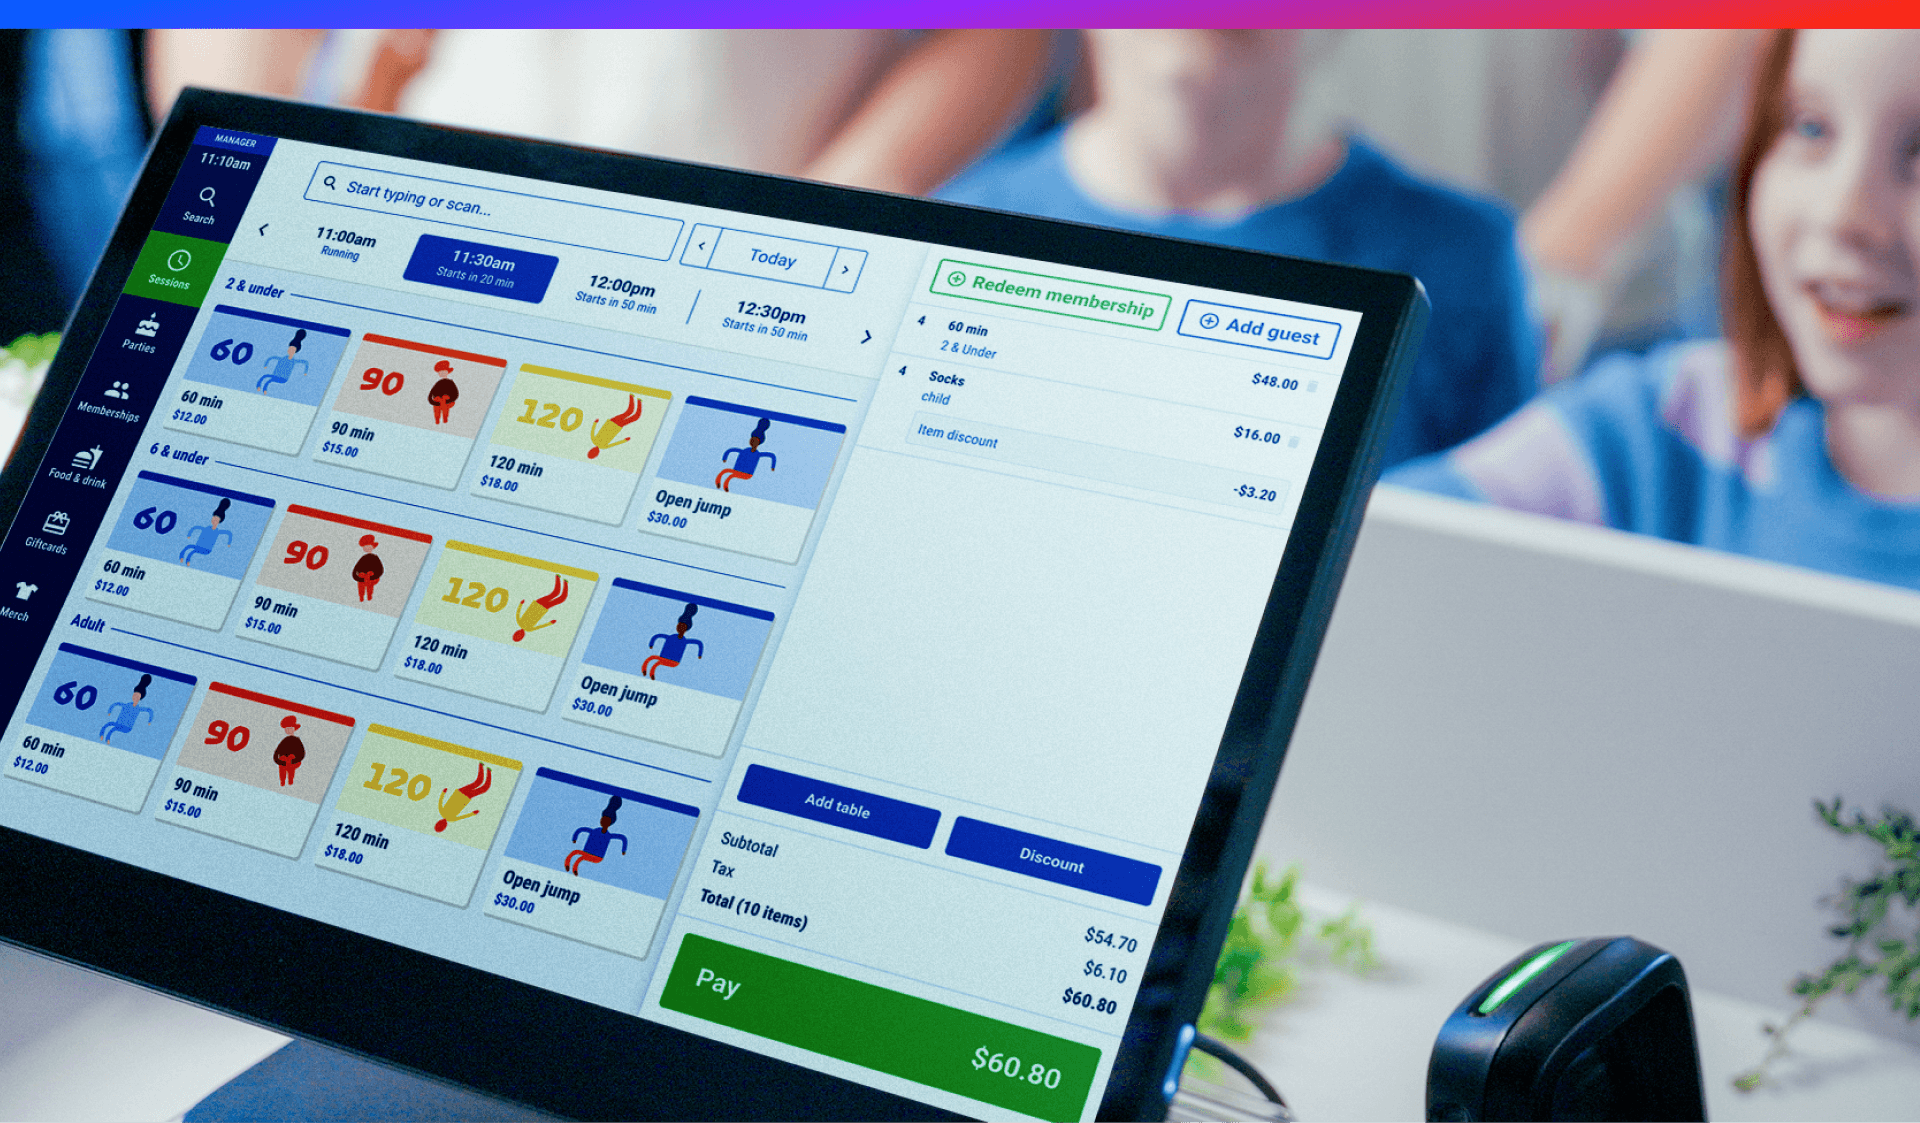
.webp?width=820&name=Blog%20thumbnail_Point%20of%20Sale%20Analytics_%20How%20to%20Turn%20POS%20Data%20Into%20Smarter%20Decisions%20(1).webp "ROLLER's POS at a venue")
Every sale at your venue tells a story. Whether it's a family buying another round of laser tag, friends grabbing last-minute bowling tickets on a rainy afternoon, or a regular adding extra arcade credits for the third week in a row, each transaction holds clues about your audience, their preferences, and how your business is really performing. The question is: Are you listening?
Point of sale (POS) analytics helps you understand the daily stories your venue is telling. Analytics tools turn raw sales data into actionable insights through detailed POS data analysis, showing which experiences drive repeat visits, when guests are most likely to spend, and opportunities you might otherwise miss. By paying attention to your POS data, you stop guessing and start making smarter decisions to grow your business.
In this article, we’ll explore what POS analytics tools are, why they matter, and how to use them to boost revenue and keep guests coming back.
What are point of sale analytics? (And how they help your venue grow)
Point of sale (POS) analytics is the process of collecting and analyzing data from your POS system, such as sales, guest behavior, and staff performance, to uncover insights that help you improve operations and grow revenue.
Your POS system already tracks a lot of information during each sales transaction, including what was sold, when, who sold it, and at what price. Point of sale analytics tools bring all this data together, uncover patterns, and deliver actionable insights and reports about sales, customers, and operations.
Read more: Save Up to 125 Hours per Year With Analytics
How point of sale analytics work
Here’s a closer look at how point of sale systems actually work:
Step 1: Data collection
Everything begins the moment a transaction happens. A guest swipes their card, and your POS captures the details like time, date, items purchased, and payment method. That information goes into your system’s database, where it’s organized and stored, saving your venue both time and money. For example, a family buys a laser tag session, adds drinks, and pays with a credit card. All of those details are automatically logged.
Step 2: Analysis
Next, the analytics tools get to work. They sort transactions into categories, compare performance across different time periods, and calculate key metrics such as average transaction value or revenue per guest. For example, the system might spot that laser tag sessions pick up every Friday afternoon between four and six, or that guests tend to spend more when you pair arcade credits with a snack or meal.
Step 3: Insight
Reporting tools then take that organized data and present it in a sales analytics dashboard, making trends easy to spot and decisions easier to make. For example, a dashboard might show that birthday party bookings are down this month or that your new combo meal is now your top seller.
Step 4: Action
With those insights in hand, you can make smarter decisions. You might adjust staffing during peak hours, introduce a new package, or highlight experiences that guests already love.
For example, if weekday afternoons are slow, you could launch a weekday discount.
How cloud systems support each step
Modern cloud-based POS systems strengthen the entire process by syncing data automatically across all your locations and devices, providing real-time POS reporting so you can instantly act on trends. This means you don’t have to export spreadsheets or piece together information from different reports because everything updates in real time.
For example, imagine you have two locations and your arcade sales suddenly spike at one of them on a Saturday afternoon. Because the data updates instantly, you can shift staff, restock prizes, or promote a special while the rush is still happening. Without cloud syncing, you wouldn’t see this until the next day, which means you would miss the chance to act when it counts.
Key metrics to track in point of sale analytics
Not all POS data carries the same weight. Some numbers just confirm what you already know, while others can completely change how you think about your business. Here are the ones worth paying attention to.
- Revenue per guest: Measures how much revenue each guest brings in on average, which helps you understand overall spending behavior
- Average transaction value: Shows the typical amount spent in a single purchase, which helps you track upsells and purchasing patterns
- Product or category sales: Tells you which items or categories are performing well so you can focus on what drives revenue
- Time-based performance: Highlights when sales peak or slow down, helping you plan staffing and promotions
- Staff productivity: Measures how effectively team members handle sales so you can support training and schedule more efficiently
Now that you know the key metrics, here’s how they look when you turn raw POS data into actionable insights that help you run your venue more effectively:
|
Raw POS data |
Actionable insight (from POS analytics) |
How it helps venue operators |
|
Daily ticket sales |
Identify busiest days and slower stretches |
Staff appropriately and run promos that lift slow periods |
|
Average transaction value |
Spot moments when guests naturally spend more |
Create bundles and encourage higher-value add-ons |
|
Product sales by category |
See which items perform well and which don’t |
Optimize inventory and refine menu offerings |
|
Time of purchase |
Pinpoint peak transaction times |
Reduce lines and improve traffic flow |
|
Staff sales performance |
Compare team productivity |
Reward strong performers and offer training when needed |
|
Refunds or voids |
Flag recurring issues or training gaps |
Reduce errors and boost guest satisfaction |
|
Guest repeat purchases |
Track loyalty and return behavior |
Launch or improve memberships and rewards programs |
Benefits of POS analytics for attractions and FECs
Retail stores and restaurants have been using retail POS analytics for years, but attractions and Family Entertainment Centers (FECs) operate differently. You are not just tracking inventory or table turnover. You are managing capacity, coordinating multiple activities, planning around weather and school schedules, and trying to make the most of every square foot of your space.
Smarter staffing decisions
POS analytics show exactly when your venue is busiest and when it is slower, allowing you to schedule the right number of staff at the right times. You can avoid long lines and overwhelmed employees while also reducing labor costs during quieter periods. By aligning staffing with actual guest flow, you create a smoother experience for visitors and a more efficient operation for your team.
Better inventory and pricing strategies
Analytics reveals which items or activities are popular and which are underperforming. For example, guests might consistently buy loaded nachos while leaving hot dogs untouched. This information helps you decide what to stock more of, what to update on the menu, and how to price items to maximize revenue without disappointing guests. You can also identify seasonal trends and adjust offerings to match demand.
Higher guest satisfaction
With POS analytics, guest behavior patterns come into focus. Are visitors more likely to add extras when booking online versus in person? Do groups consistently spend more than individuals? Which promotions drive revenue, and which only eat into margins? With these insights, staff can make informed recommendations, experiences flow more smoothly, and guests quickly find what they want. A well-run venue with fewer bottlenecks and better product availability keeps visitors satisfied and encourages them to return.
Increased profitability
With venue management analytics, you can combine insights from staffing, inventory, and guest behavior to make smarter decisions that increase revenue and improve guest experiences. You can optimize pricing, create high-value packages, and run targeted promotions based on actual guest behavior. Over time, these improvements boost profitability while improving the overall guest experience.
With venue management tools like ROLLER, these insights are available in real time, letting you respond quickly to trends, adjust operations on the fly, and ensure guests have the best possible experience.
Read more: How ROLLER Analytics Helps Venues Grow Memberships
Real-world example: Airborne Trampoline Park
POS analytics can uncover opportunities that might otherwise be missed. At Airborne Trampoline Park, ROLLER Analytics provided clear dashboards that helped the team gain buy-in from ownership and marketing.
Using demographic reports, the Airborne team spotted a chance to boost weekday sales for the four-and-under segment. They launched a “Toddler Time” package, offering a discount to adults buying a ticket with a toddler ticket, available from open to 1 PM, Monday through Friday.
The results were immediate, with sales rising during a previously slower time block, showing how data-driven decisions can unlock hidden revenue without changing the facility or equipment.
Keep reading: How Airborne Trampoline Park drives $1M+ with ROLLER’s food and beverage solution
How to get started with point of sale analytics
The good news is that you likely already have access to more analytics than you realize. Most modern POS systems come with built-in reporting and dashboards. The key is using them effectively.

ROLLER Analytics membership dashboard
Centralize your data
Start by bringing all your data into one place. If you are using multiple systems that do not communicate, you are making analysis harder than it needs to be. Look for integrated venue management platforms that handle bookings, admissions, POS, memberships, and inventory in a single ecosystem. When your data lives together, uncovering insights becomes much easier.
Use dashboards
Set up dashboards that highlight the metrics that matter most for your business. You do not need to track everything. Focus on what drives the decisions you make every day. For most attractions, this includes revenue trends, guest counts, product performance, and staff productivity. Dashboards make patterns easy to spot and insights actionable at a glance.
Train staff to use insights
Analytics only deliver value if your team understands and acts on them. Make it part of your weekly routine to review key metrics together. Ask questions like: What sold well? What didn’t? Were there any surprises? Encourage everyone to think about the story the data tells and how it can guide daily operations.
Leverage artificial intelligence
Modern POS systems are increasingly using AI to make analytics faster and more accessible. For example, ROLLER’s AI-powered assistant, ROLLER iQ, translates raw data into clear, personalized insights, highlighting sales trends, guest behavior, and growth opportunities automatically. It is like having a data analyst built into your platform, helping you make smarter decisions in less time.
Read more: How ROLLER iQ Makes Business Intelligence Smarter and Simpler for Operators
Next steps
Every sale at your venue is more than just a number on a screen. It's someone choosing to spend their time and money with you, and that choice contains information. Point of sale analytics helps you listen to what your guests are telling you through their purchasing behavior.
The attractions that will succeed in the years ahead are the ones that treat data as a strategic asset, not in a complicated or overwhelming way, but in a practical, day-to-day way that makes running the business easier and more effective.
Book a demo today and discover how ROLLER helps you streamline operations, so you can focus on what matters most: giving your guests the best experience possible.


.webp)
.jpg)
.jpg)
