
3 minute read
Last updated:

Our goal at ROLLER is to help operators like you grow your business. We’ve been listening closely to your feedback and heard that in order to grow, you need visual reporting that helps you easily understand where you’re excelling and where you can improve.
So, in an industry first, we’ve partnered with Google BigQuery to bring you Analytics, a business intelligence tool that will give you actionable insights into your venue performance!
Stay ahead of the curve with Analytics
With Analytics, you can view all your critical revenue, guest, and membership metrics via easy-to-consume reports and visual dashboards. Insights are built into the ROLLER platform, helping you access a meaningful snapshot of your business performance without spending time on manual data analysis or exporting your ROLLER data to another tool.
Most importantly, these insights are presented in an actionable way, helping you look beyond the day-to-day to understand how to drive your business forward into the future. Instead of waiting for sales and transactional data to show changes that have already happened to your business, you can be more proactive with your business growth by tracking revenue and guest trends, maximizing what’s working well, and prioritizing where to invest to boost revenue.
The benefits of tools like Analytics are clear—businesses leveraging business intelligence tools could see the following benefits:
- Up to 125 hours per year saved on data analysis
- An increase of up to 2.5% in operating income
Now let’s run through what’s available.
New visual dashboards
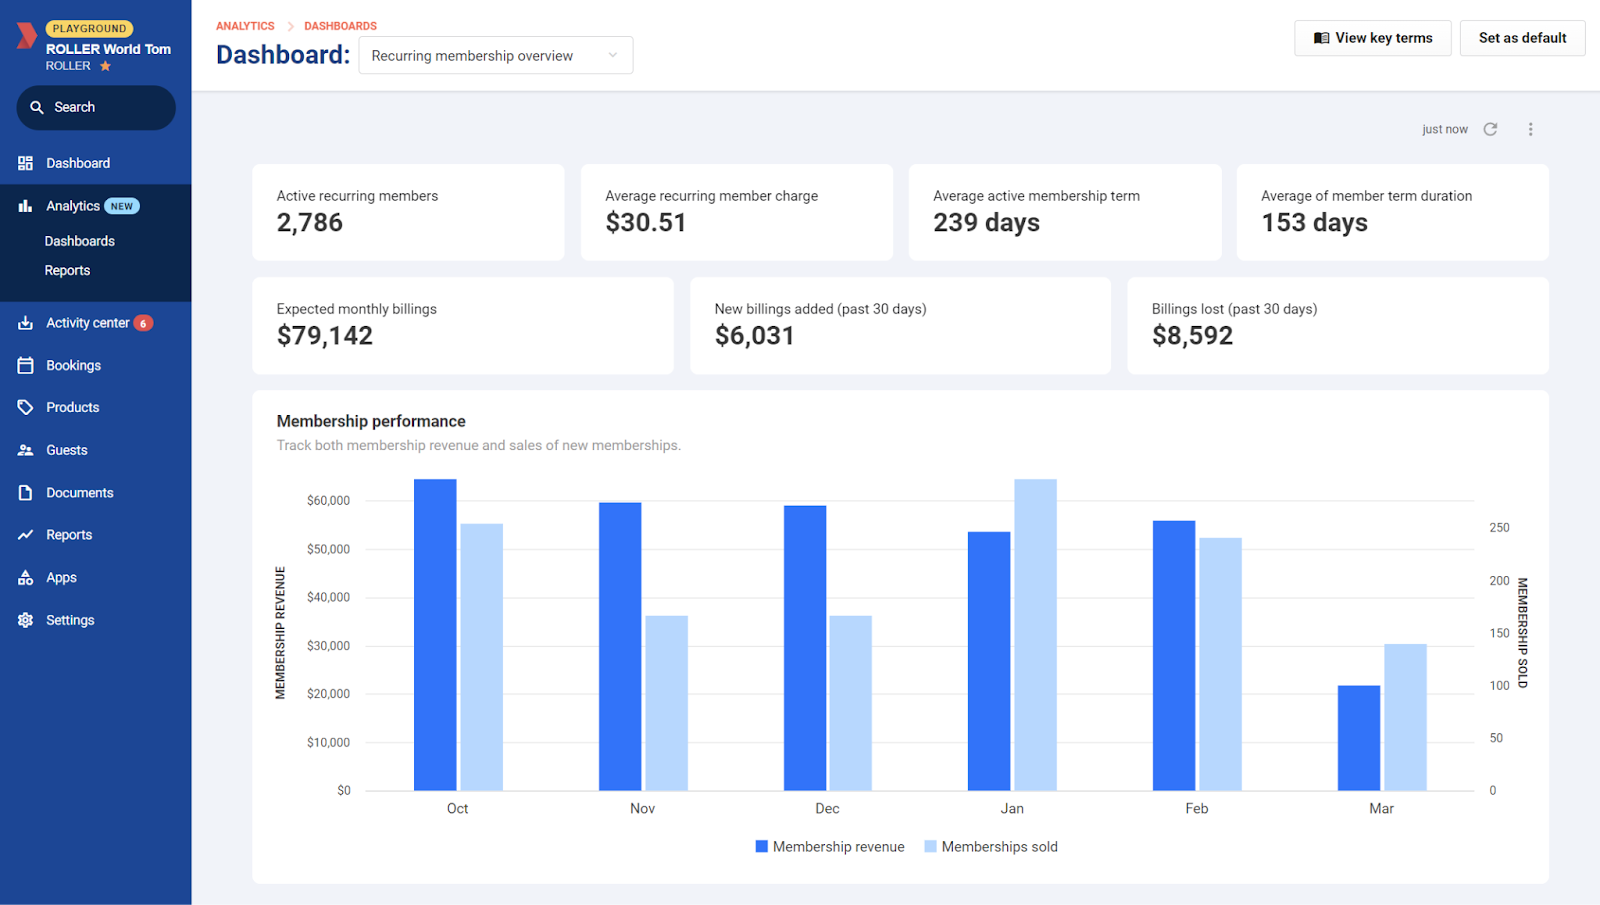
Our pre-built dashboards provide an intuitive visual summary of how your business performance metrics are trending over time. Explore revenue, guest, and membership trends at a glance to pulse-check your performance and identify when you need to dig deeper with reporting.
Actionable reporting
Alongside these detailed dashboards, you’ll also have access to three highly requested reports:
- Deferred revenue: Track your income for products and services that haven’t yet been redeemed, like party deposits or advance payments for bookings
- Discount code usage: Track how often your discount codes are being used, and the funds received from the discounted bookings
- Membership product sales: Deep dive into how your different membership products are performing
This is in addition to the full suite of reporting already available in ROLLER.
Grow party and membership revenue with Advanced Analytics
Customers on a Premium or Enterprise plan can access Advanced Analytics, designed for operators who want to dive deeper into performance metrics, ramp up their party and group booking revenue, and maximize recurring revenue from memberships.
What’s included in Advanced Analytics?
Advanced dashboards
- Membership retention
- Membership visitation
- Party package insights
- Online checkout revenue
- Venue performance trends
Advanced reports
- Revenue YoY
- Revenue by hour
- Guest age distribution
- Staff sales performance
- Member demographics
- Party spend, size, and value by month
- Average cart size by month
Turn insights into impact
Analytics gives you the metrics you need to make informed decisions about your operations, product offering, marketing strategy, and guest experience and, in turn, track the impact of those changes on your bottom line.
Here are just a few examples of how Analytics can help you turn insights into impact.
Guest insights
This guest dashboard shows key guest purchasing and visitation patterns over the last year:
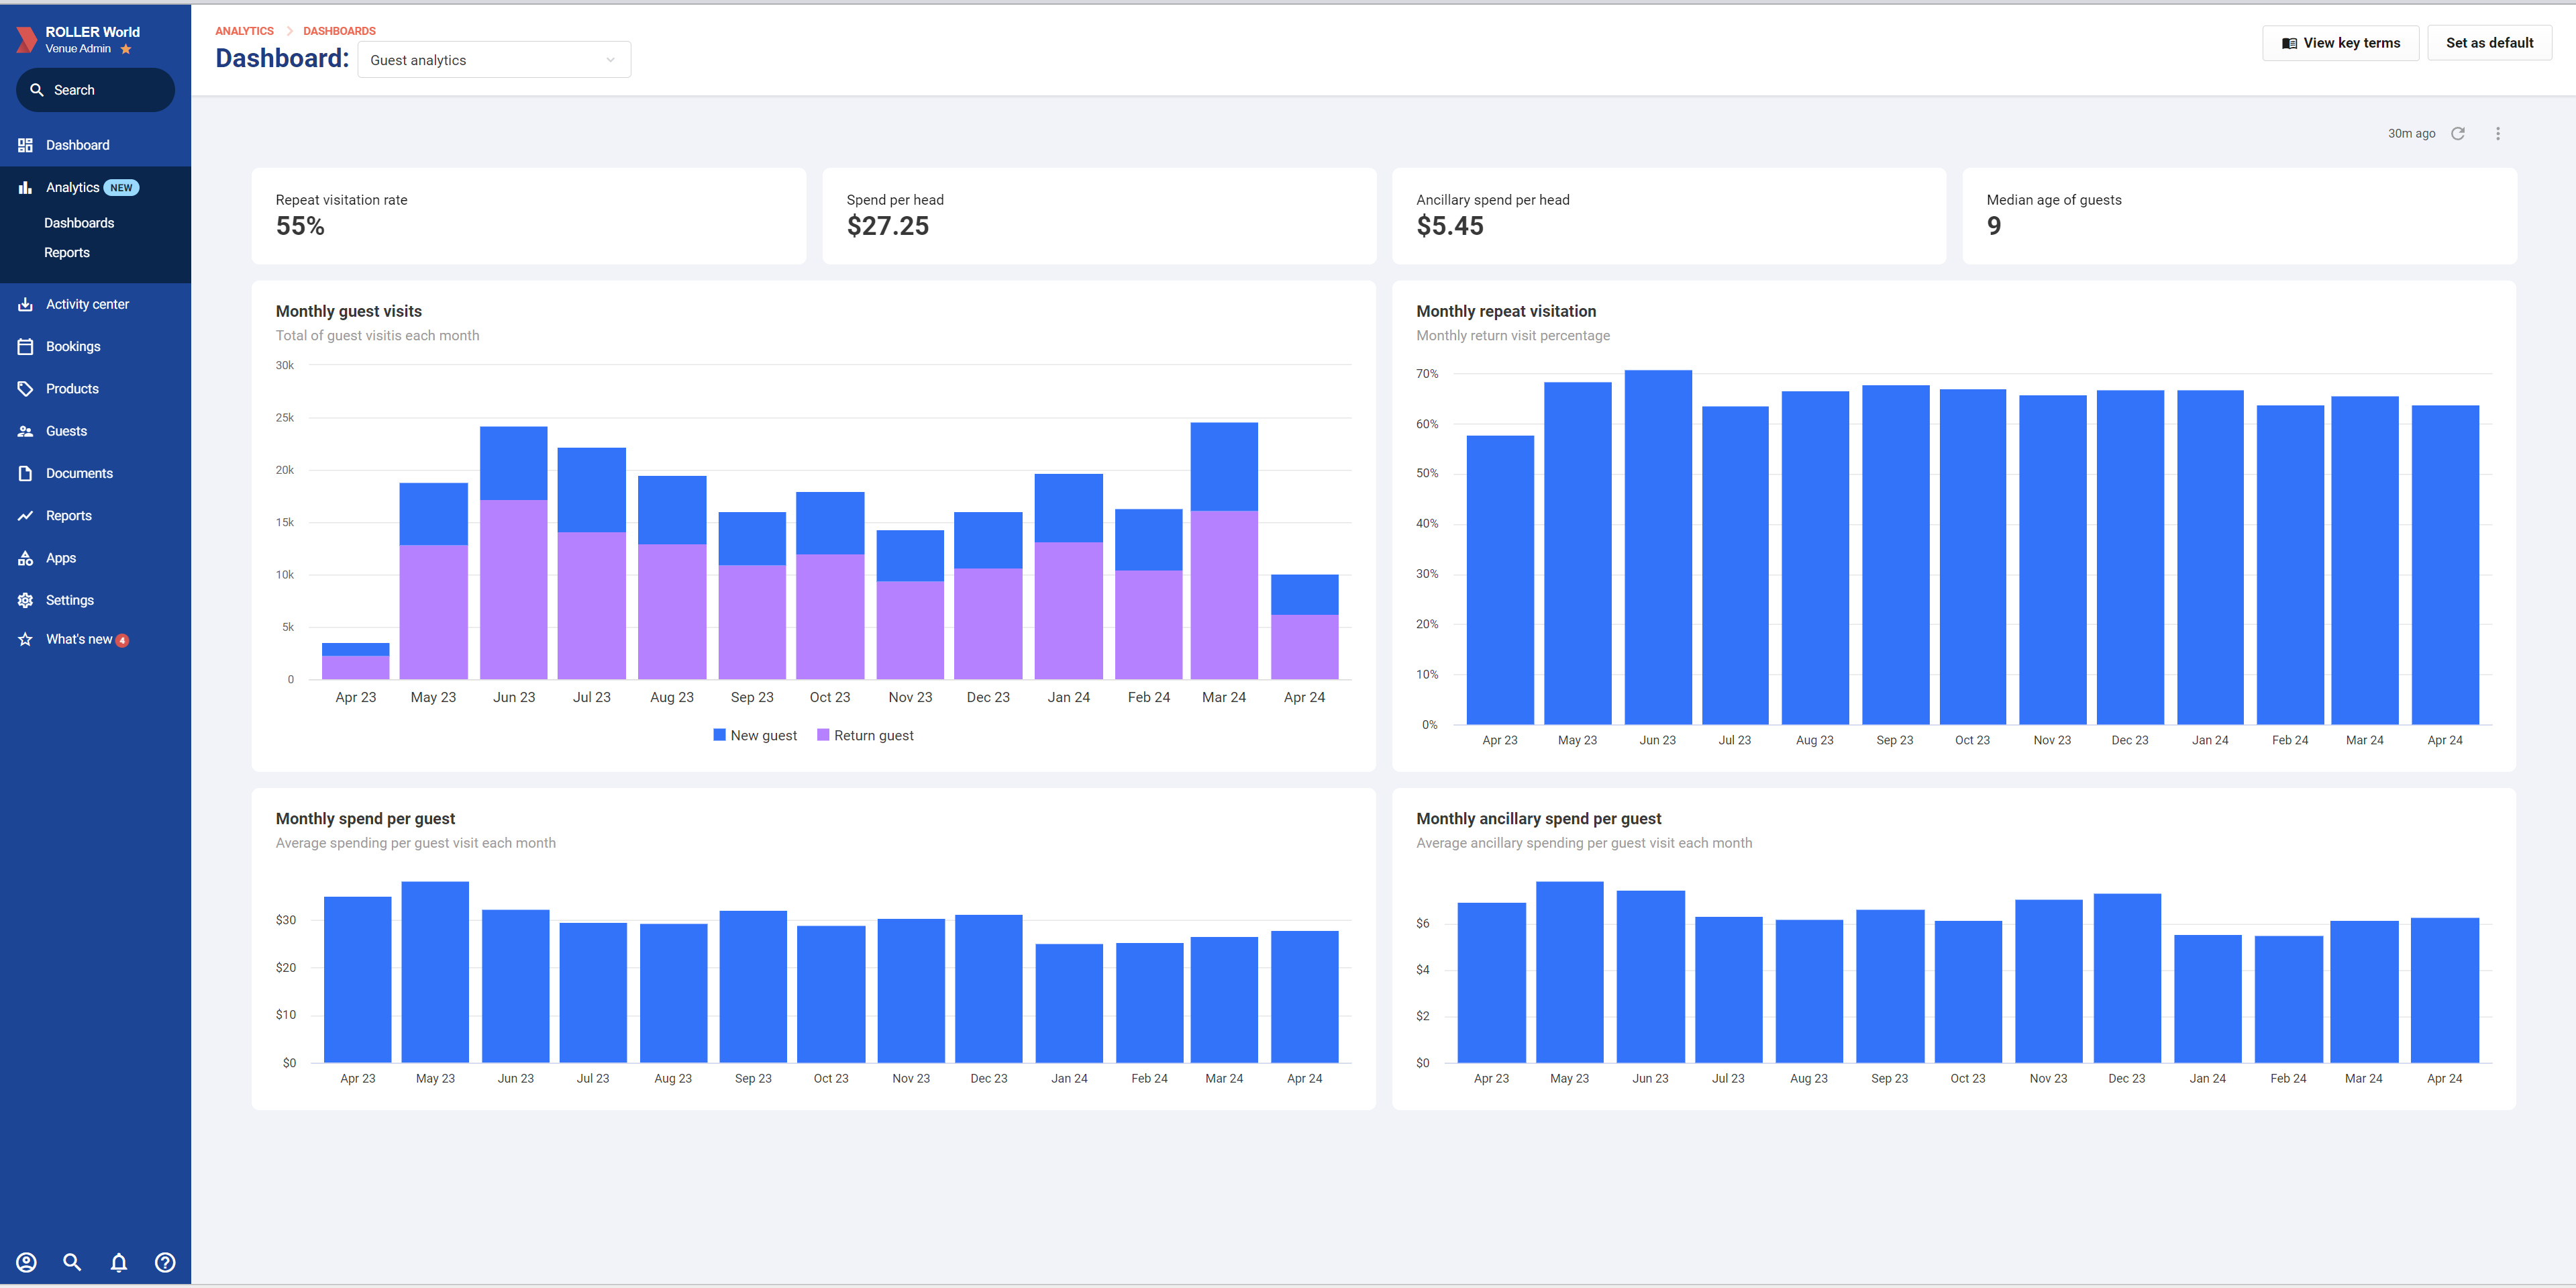
In this example, the repeat visitation rate is 55%, meaning that 55% of guests have visited more than once in the past year. A venue seeing this trend could consider upselling return visitors to a membership. This not only locks in additional revenue for your venue but also provides additional value to your customers—whether that’s bonus inclusions offered as part of their membership or VIP service during their visit.
Revenue insights
This revenue dashboard shows earnings over the last year, broken down by sales channel:
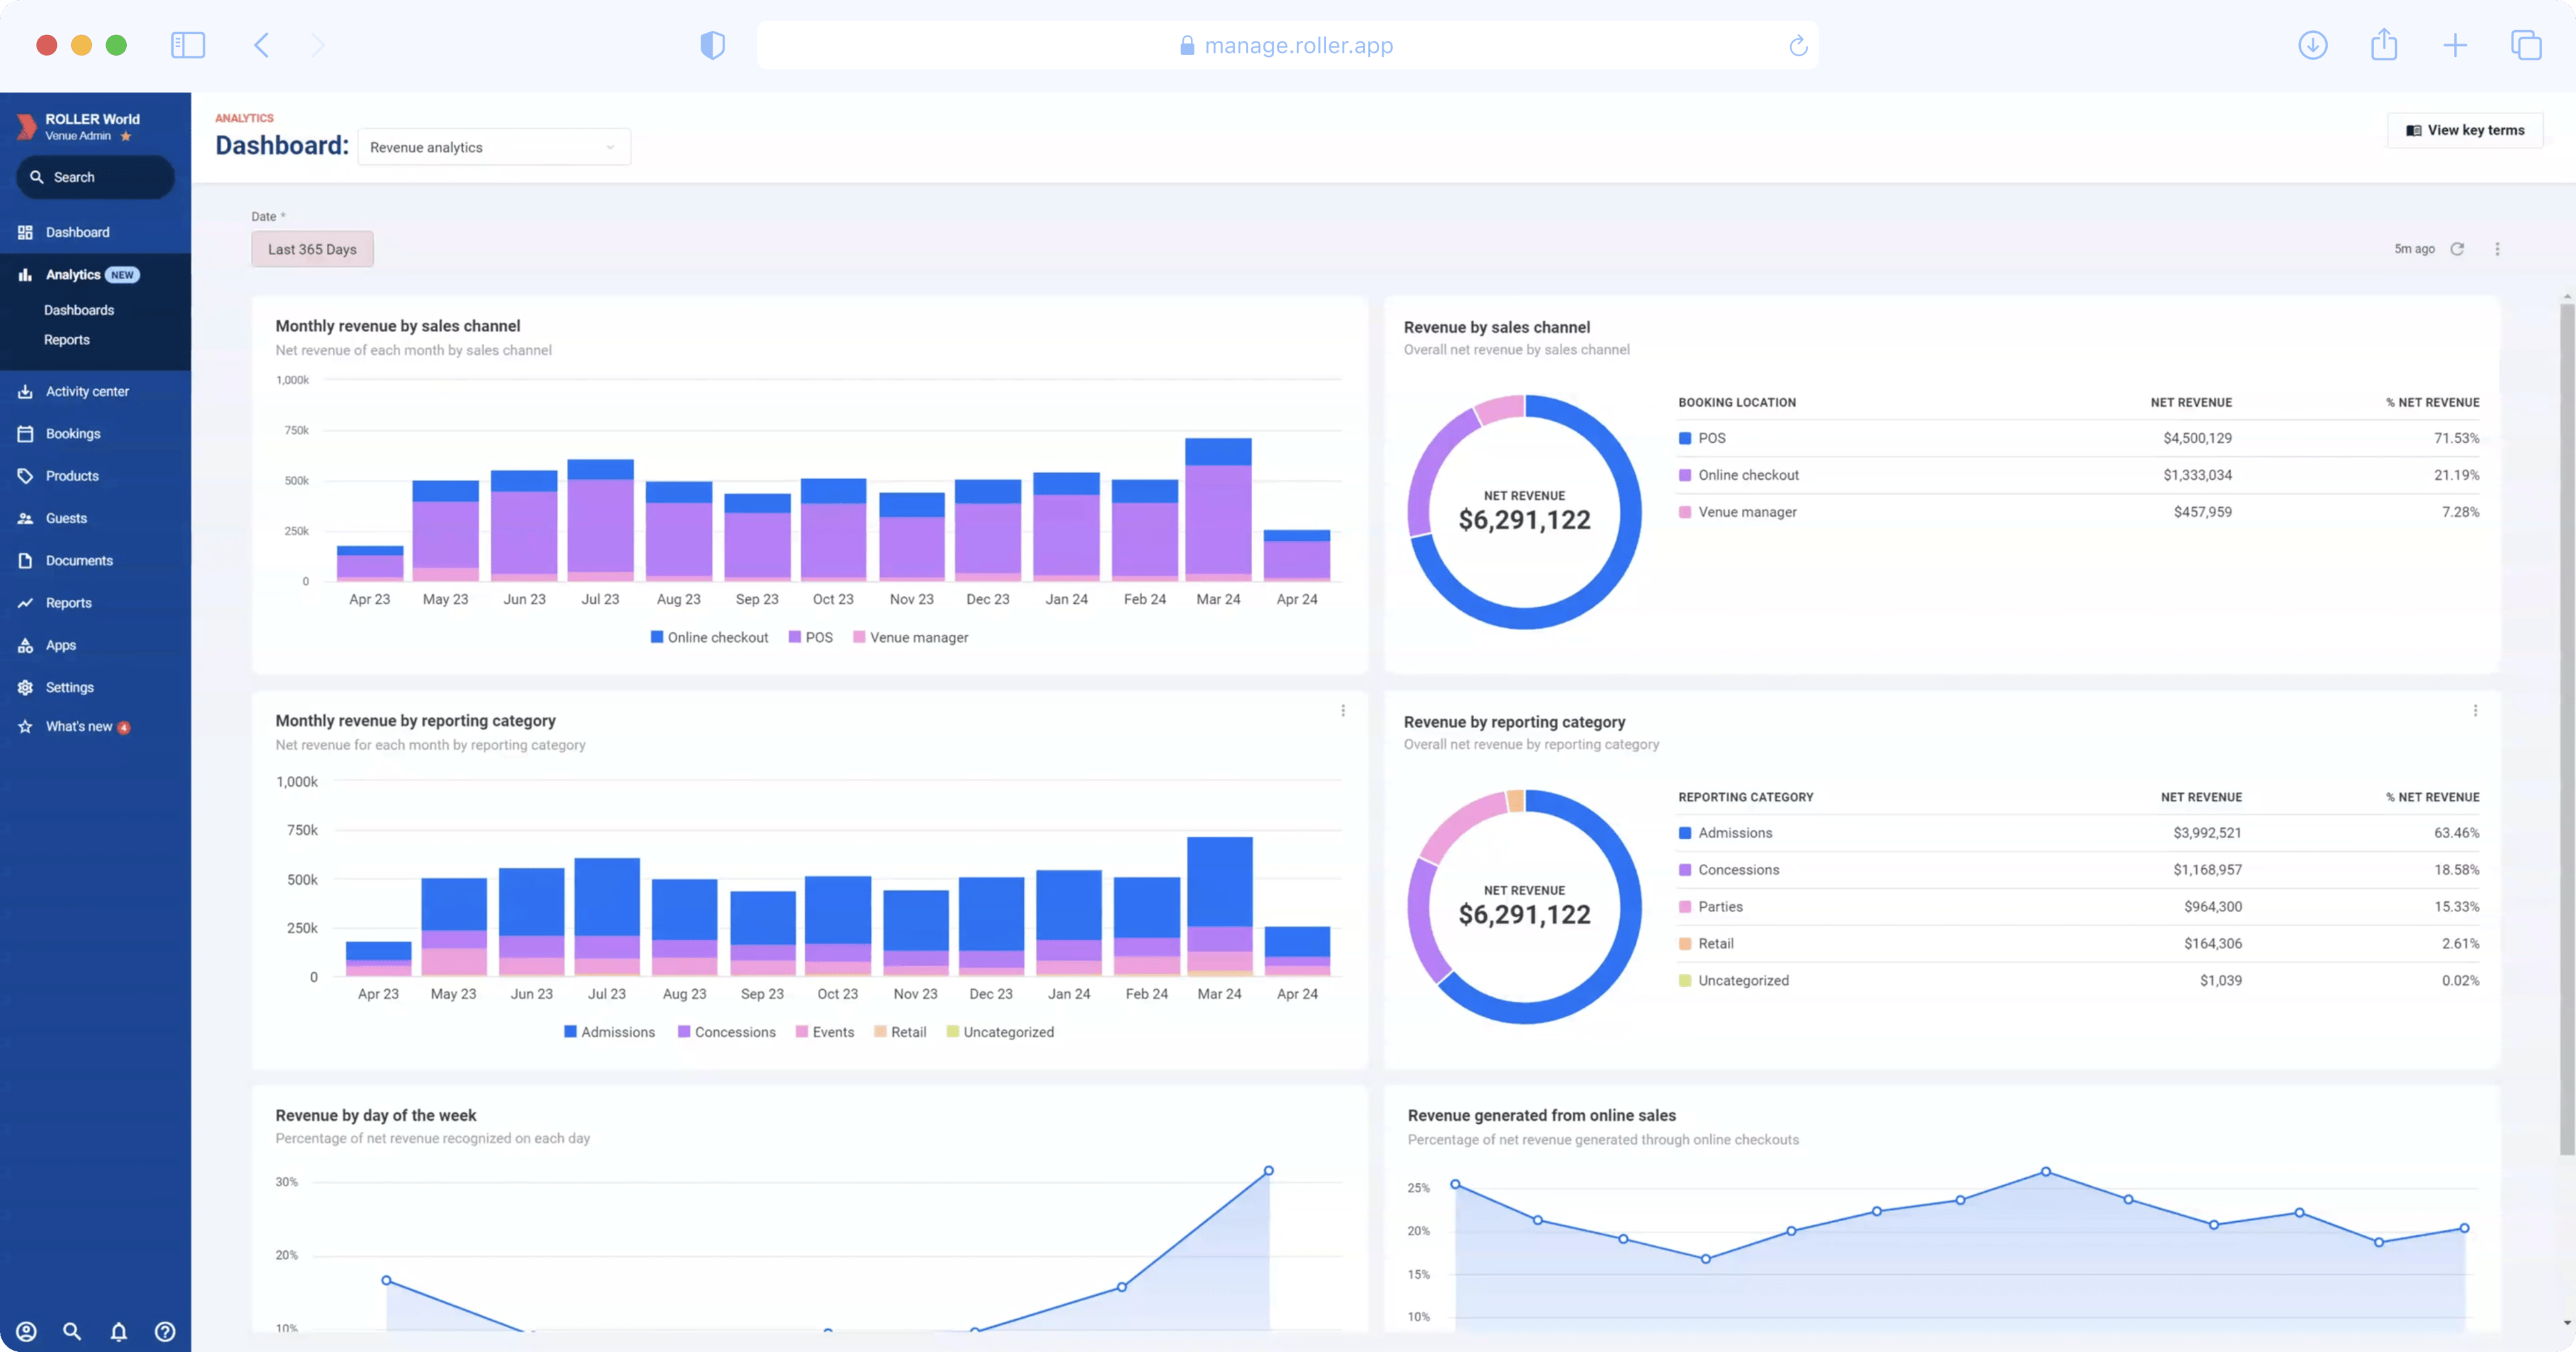
In this example, most guests make bookings in person via point of sale (POS). A venue seeing this trend could:
- Further increase in-person purchases by upselling guests at POS with additional experiences, food, or merchandise.
- Trial promotions to increase online revenue, such as discounts for bookings made online. Although in-person sales are a great source of revenue, online bookings are more efficient from a labor standpoint, as you don’t need to employ as many POS operators to take bookings. Plus, online bookings open up a 24/7 sales channel.
Get started with Analytics
Analytics is free for all ROLLER customers, and Advanced Analytics is available on the Premium and Enterprise plans. Find out more or upgrade via our Help Center today!
Not a ROLLER customer? Get a demo to learn more about how ROLLER helps you grow your business.


.webp)
.jpg)
.jpg)
