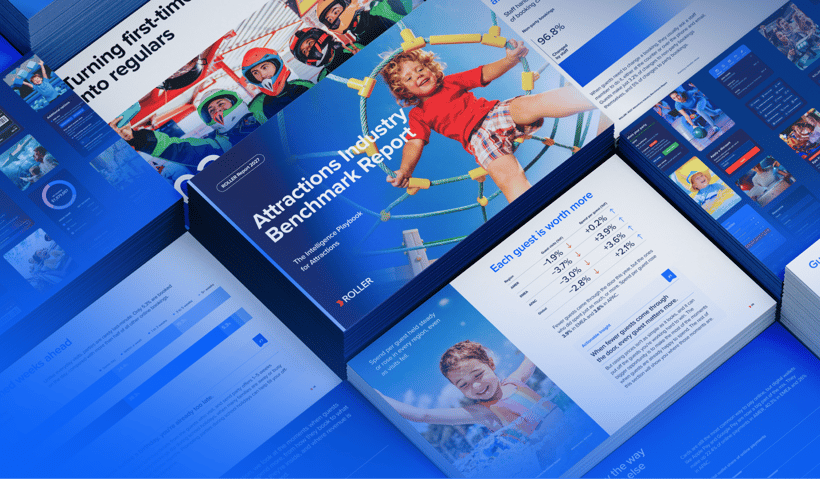
Where’s the growth for attractions in 2027? That’s the question we set out to answer in this year’s Attractions Industry Benchmark Report.
The answer looks a little different this year. For most venues, the biggest opportunity isn’t finding more new guests. It’s getting more from every visit, bringing more guests back and freeing your team to spend their time where it matters most.
Here are 6 of the biggest takeaways from the report, plus practical steps you can take right away.
Curious how your venue compares? Download your free copy of the full report.
What is the 2027 Attractions Industry Benchmark Report?
The 2027 Attractions Industry Benchmark Report is ROLLER’s annual look at how attractions are performing around the world. This year, it draws on more than 53 million bookings, almost 95 million guest visits and almost 700,000 guest feedback responses from more than 1,600 venues in 33 countries.
Whether you want to grow revenue, bring more guests back or free up your team’s time, the report shows you where the industry sits and how your venue compares. Every finding comes with practical next steps, plus real stories from operators already putting them into action.
6 key takeaways from the 2027 Attractions Industry Benchmark Report
1. Guests spend more online
Online checkout baskets are more than 3.5x larger than at POS, with the average online basket at $69.90, compared with $19.90 at the counter. Even so, fewer than 1 in 3 bookings is made online. That means most guests are still booking in the channel where they spend the least.
What to do: Make online the easiest way to book. Put your booking button front and center on every page, keep checkout short, and offer add-ons before guests pay.
2. Parties are your most valuable booking
A party booking is worth more than 6x a non-party booking: $245.34, compared with $39.18. Parties bring bigger groups, and each party guest spends more. And with almost 60% of parties booked 1 to 5 weeks ahead, there’s plenty of time to win the booking before the big day.
What to do: Package and price parties as the premium experience they are. Capture birthday details from every guest, and start promoting parties 3 to 5 weeks before each birthday comes around.
3. Growth starts with the second visit
Just 12% of guests return, but they drive 26.6% of revenue. That makes each returning guest worth about 2.7x a one-time guest. Members are proving their worth too, with membership revenue up 12% this year, even as new sign-ups dipped.
What to do: Give every first-time guest a reason to come back. Follow up within a week of their visit with an offer for their next one, and make your membership easy to find and easy to join.
4. Parties and memberships work best together
Venues that offer both parties and memberships see more than double the repeat visits of venues that offer neither. Members also visit 4.4 times a year, compared with just 1.4 for non-members. And every party brings a group of guests through your doors at once, which makes it one of the best moments to introduce your membership.
What to do: Treat every party as an introduction to your membership. Add a membership offer to party packs, thank-you emails and follow-ups to the parents who came along.
5. Self-service gives your team time back
Staff handled more than 1.5 million booking changes between January and June 2026. Guests make just 3.2% to 5.0% of booking changes themselves, so almost every request lands with your team. Those few minutes per request add up to a lot of time your team could be spending with guests.
What to do: Give guests a way to manage their own bookings with online accounts, then make sure they know it’s there. Add a “Manage my booking” link to every confirmation and reminder email.
Read more: 5 Ways to Drive Guest Adoption of Self-Service Tools
6. A smoother check-in starts at booking
42% of waivers are signed within an hour of the visit. That often means guests are signing in the parking lot or in line, right when they’re most eager to get started. And with 65.7% of venues already using digital waivers, the tools to fix it are within reach.
What to do: Send a digital waiver link with the booking confirmation, follow up with a reminder the day before, and make it easy for parents to add their kids to a single waiver.
Beyond the report: See how your venue compares with ROLLER iQ
The report shows you the industry benchmarks. ROLLER iQ shows you where your venue sits against them. Ask a question in plain language, like “How does my share of online bookings compare with the industry?”, and get answers from your own data, along with recommendations on what to do next.
Learn more about ROLLER iQ
Ready for the full 2027 Attractions Industry Benchmark Report?
These 6 takeaways are just the start. The full report covers regional breakdowns, industry comparisons and more findings on online booking, mobile ordering, kiosks, payments and guest feedback. You’ll also find real stories from operators and insights from ROLLER’s own industry experts.
Download your free copy and make 2027 your strongest year yet.